Photo by Chris Cruz San Pablo Bay
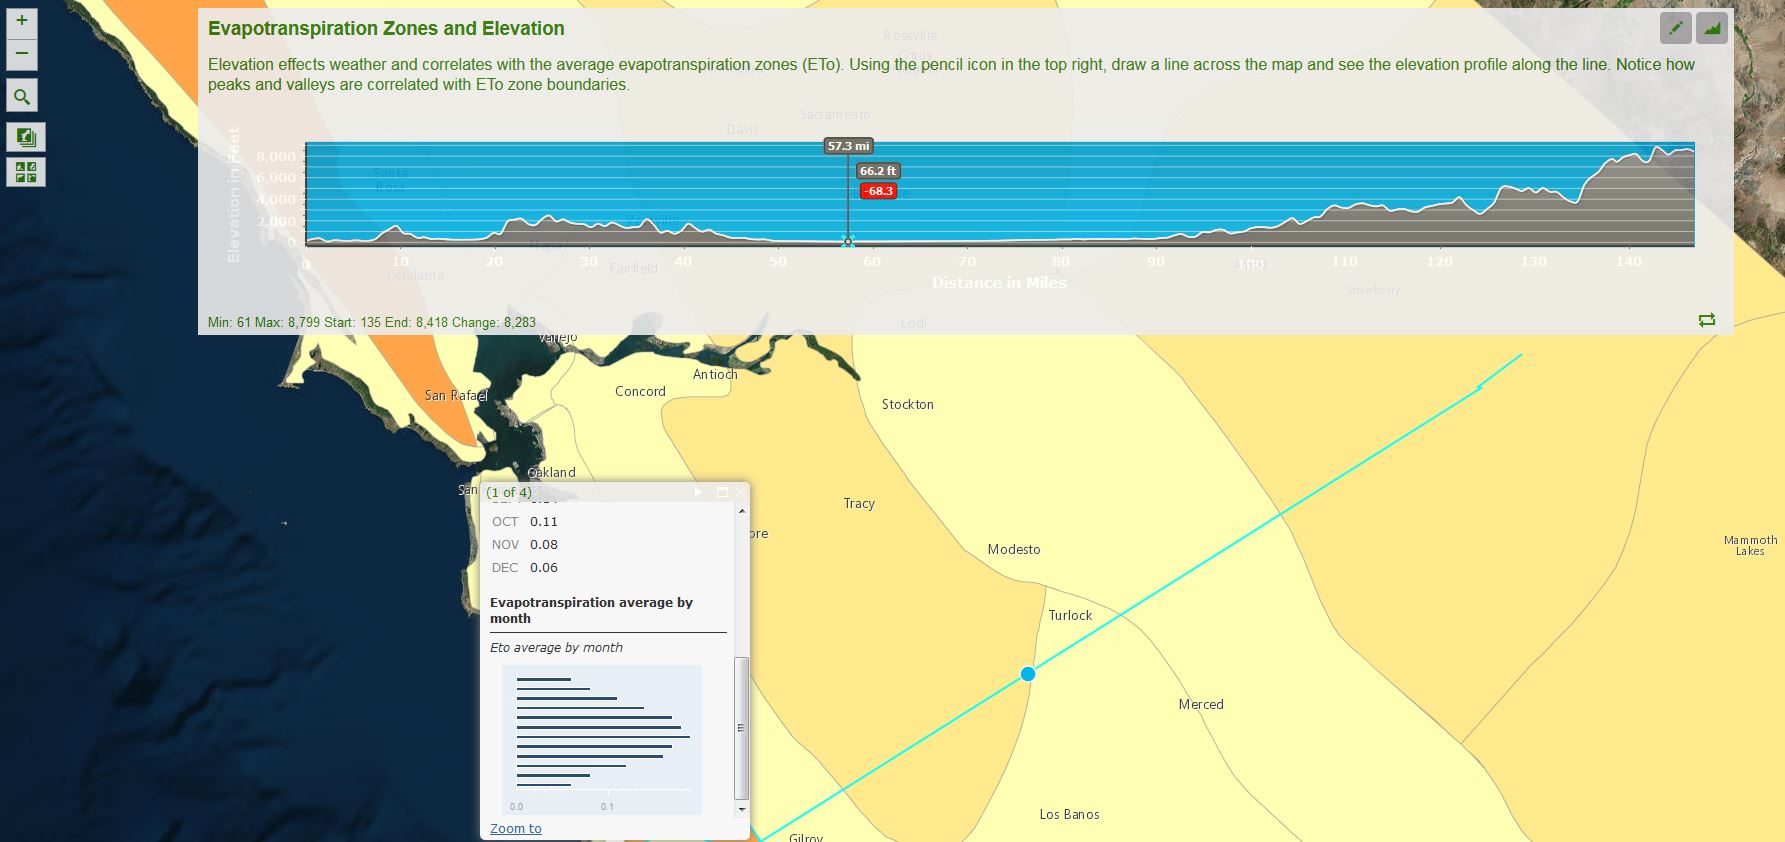
Elevation and distance from the ocean effects weather and evapotranspiration (ETo) or water loss from plants. This map of the Evapotranspiration Zones correlated with Elevation is interactive. Clicking the map will allow you to visualize the data by presenting you with an elevation profile and the evapotranspiration data. Use the pencil icon in the map to draw a line across the map to see the elevation profile along the line. Notice how peaks and valleys are correlated with ETo zone boundaries. For daily ETo values and solar radiation visit the CIMIS Spatial Data website and click on the spatial tab. "The evapotranspiration zone boundaries were developed by DWR and UC Davis and divides the State into 18 zones based on long-term monthly average ETo. The ETo values were calculated using data from various data sources including CIMIS weather stations that had at least five years of archived data."